
Features
Mobile Forms
Turn Field Intuition into Actionable Data with Loamy's Field Estimates Tool
.png)
Eliminate Paperwork and Standardize Operations
Paper forms are slow, error-prone, and hard to track. Loamy empowers your team to capture standardized data from anywhere—field, factory, or warehouse—giving you instant visibility and actionable insights without the manual data entry.
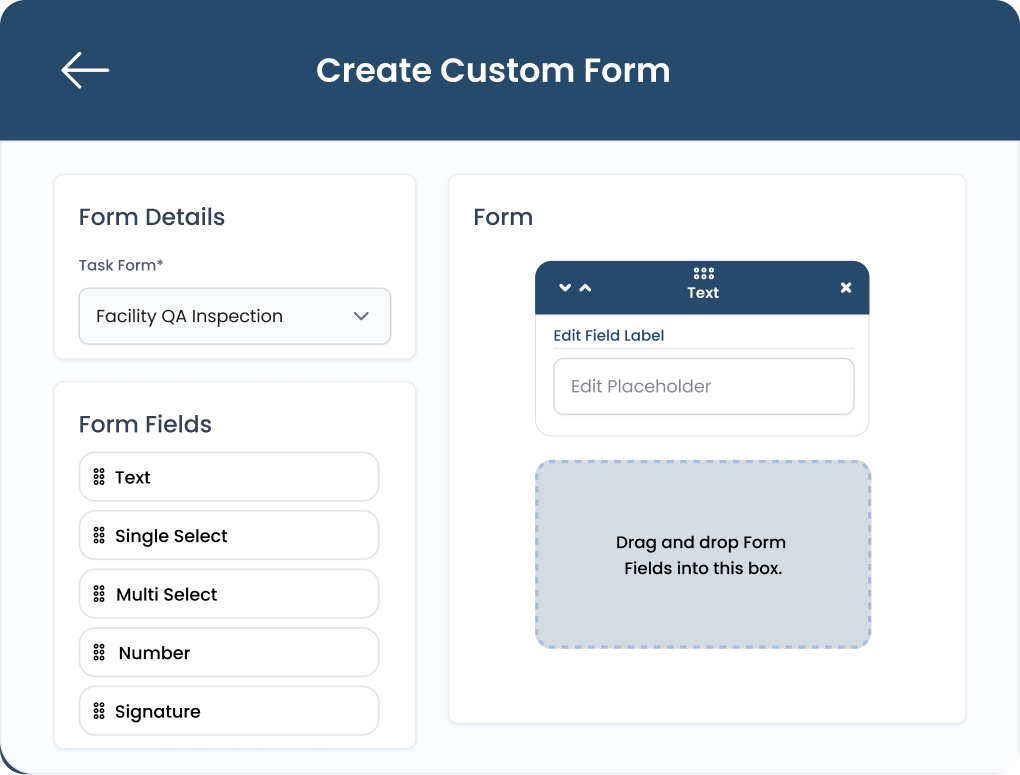
Custom Form Builder

Drag-and-Drop Interface: Easily build custom digital forms for inspections, checklists, or logs without writing a single line of code.

Smart Logic: Set required fields and conditional logic to guide workers through complex tasks and ensure data accuracy.

Role-Based Access: Control exactly which forms each employee sees, keeping their mobile workspace clean and focused.
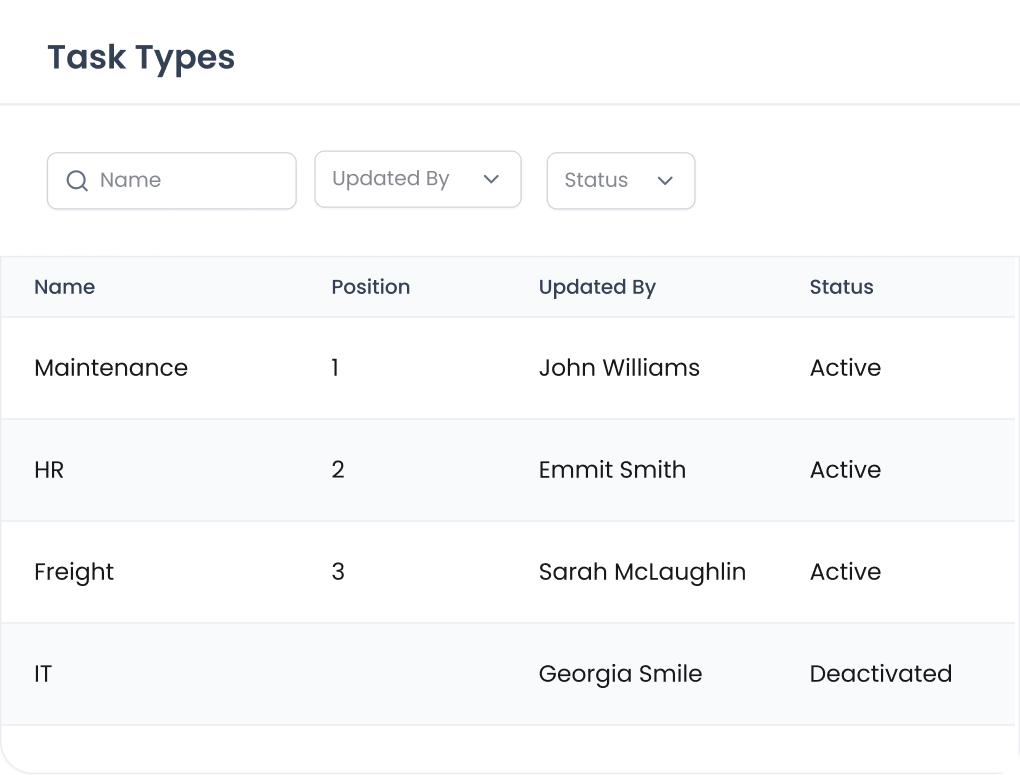
Team-Specific Workflows

Departmental Grouping: Create distinct categories for different teams—like Quality, Safety, or Maintenance—to keep operations structured.

Focused Views: Limit access so employees only see the forms relevant to their specific role.

Custom Priorities: Reorder tabs and lists to ensure your team sees the most critical workflows first.
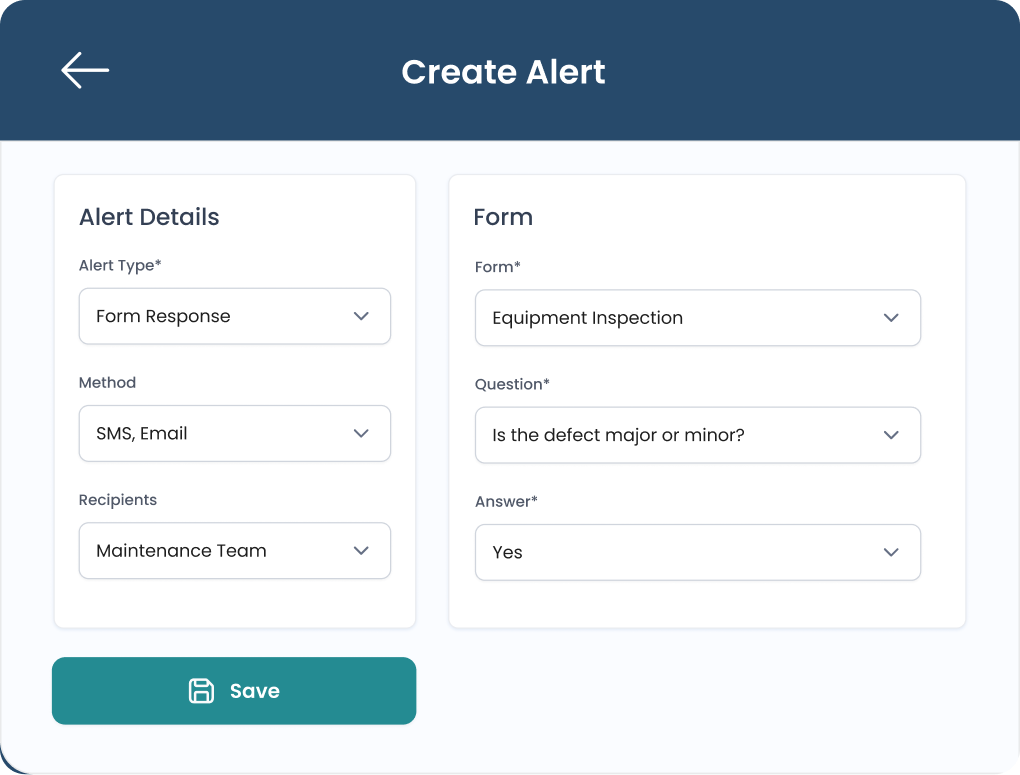
Automated Alerts

Instant Notifications: Trigger real-time emails or SMS texts to supervisors the moment a critical issue is flagged in a form.

Exception Tracking: Automatically flag late submissions or failed inspections so you can address performance gaps immediately.

Proactive Warnings: Set expiration alerts for certifications or equipment maintenance to stay ahead of compliance deadlines.
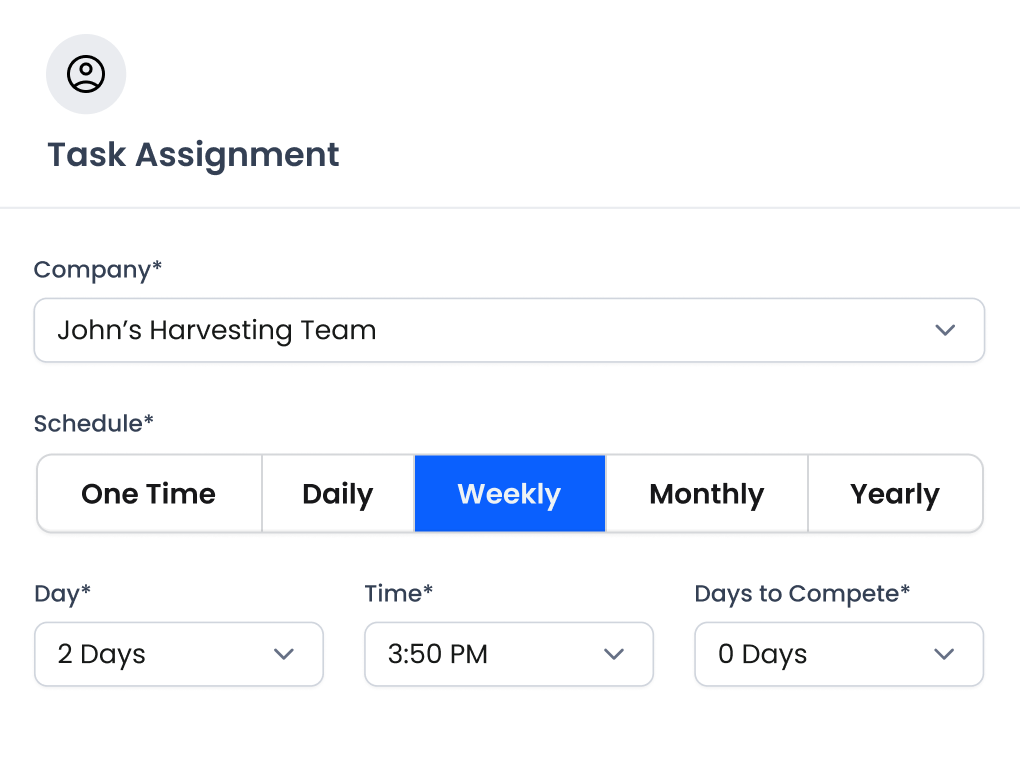
Task Scheduling

Clear Delegation: Assign specific tasks to individual team members to ensure total accountability across your daily operations.

Recurring Workflows: Schedule repeatable tasks automatically so your staff knows exactly what needs to be done and when.

Automated Notifications: Receive instant alerts for new assignments and overdue tasks to keep your team moving on time.
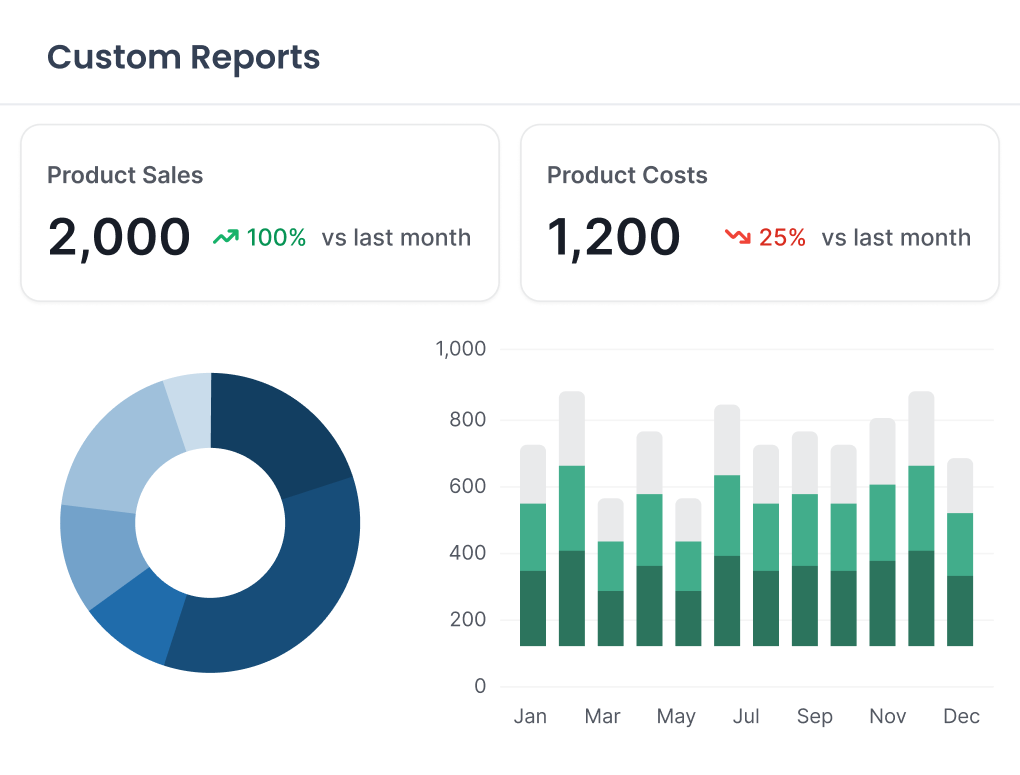
Reporting & Analytics

Visual Dashboards: Turn raw form data into easy-to-read charts and graphs to spot trends over time.

Drill-Down Detail: Filter reports by specific forms, users, or locations to identify the root cause of operational bottlenecks.

Export Ready: Instantly share professional PDF summaries or export raw data to Excel for deeper analysis.
Why Choose Loamy?
Loamy is the only food supply chain platform that combines food safety & quality with inventory, order tracking, and finances. We have designed the product from the ground up to automate traceability and support your employees and partners no matter where they are.
Request Demo


